Surfing the shockwave

I’m went on a road trip to San Diego a few weeks ago. When I got there I went straight to the beach for some hard core surfing. It was cloudy, but I ended up having fun anyway.

The thing about surfing is that it really makes you think about waves. Is this next wave worth catching? What about that one? But when I’m just sitting out in the water waiting for a wave, I start thinking about waves themselves.

The question that came to my mind was: why do waves crest as the get closer to the beach? When waves are far from shore, they approximate a sine wave. The amplitude of the wave is the distance away from sea level.

A wave in deep water.
The equation for this wave is D = D_0 + A\sin(\omega t-kx) . D here is depth, and D_0 is sea level. A is the maximum height of the wave, \omega is the angular frequency 2\pi f , t is the time, k is the wave number 2\pi /\lambda , and x is the distance away from shore.

As you can see in that equation, the depth varies with time and distance. The distance here doesn’t really have anything to do with the beach though. What could be causing the waves to break? So I did some research.

According to wikipedia, waves on a beach are shock waves. That’s right, just like the shock wave from a plane. These shock waves work slightly differently.

Here’s what happens:

The speed of a wave in water depends on the depth of the water. When a wave is in deep water far from the beach, slight changes in depth due to the wave itself have a tiny effect. When the wave nears the beach, the water is shallower and the wave itself has a larger effect.

Near the beach, the peaks of a wave travel faster than the troughs. That means that high points catch up to low points. The wave loses its sinusoidal shape and starts turning into a sawtooth wave, and sawtooth waves have discontinuities. Discontinuities manifest themselves strangely in nature. In this case, they’re manifested as the crests of the wave.

Shockwave
The shock appears as the wave travels to the right.

I modeled this by changing the wave number, k as a function of the previous amplitude. Basically, I assumed that the water got shallower as the wave moved to the right. Since I only changed the wave number and left the frequency the same, the speed of the wave changed with amplitude.

The problem with my approach is that I changed wave speed linearly, and shock waves are by nature a non-linear problem. My model worked well for small changes in the wavespeed, but large changes caused a breakdown that manifested itself as spurious peaks. I could make a better model, but right now I don’t really feel like going through all of the calculus that would require. The KZK equation is for physicists.

Model Breakdown
You can’t model a non-linear process very well with linear tools.

Find the code here.

Opening Doors

I ran into an interesting math puzzle while trawling the blag-o-sphere today.

One hundred students line up to walk by one hundred closed lockers. The first student walks by opening every locker that is closed. The second student then walks by and opens every second locker that is closed and closes every second locker that is open. The third student does the same for every third locker and the nth student does the same for every nth locker.

After all the students have walked by the lockers, how many lockers are open?

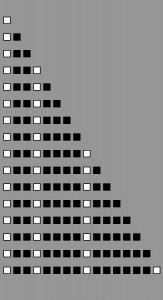
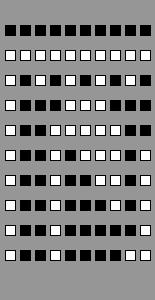
I thought about this for a while, but I was having some trouble visualizing what was happening. In the end, I decided to graph it to see what was happening. I wrote up a quick Processing sketch and looked at a smaller version of the problem. My smaller version had only ten lockers and ten people who run through them.

Timeline of ten lockers being toggled

Once you’re looking at the picture, the answer the question is obvious. I’m not very satisfied with this method of solving the problem. It seems inelegant, and is purely a brute-force approach.

Another way to approach the problem is see if there is a closed form solution for any given door. If we had that, we could solve for the state of each locker and sum them up. Unfortunately, I think this comes down to a factoring problem. If the locker number has an even number of factors, then it is closed. If it has an odd number of factors, it is open. Interestingly, since most of the lockers remain closed it seems that most numbers have an even number of unique factors. That doesn’t really help explain the problem though.

Solutions upto 16 Lockers

So if I can’t find a closed form solution to the state of each locker, what other patterns can I see? By looking at the solutions for different numbers of lockers, I see that total number of lockers needed to give a certain number of opens follows some kind of power function. Looking at the first sixteen solutions shows that if I want n open lockers, then I need 2^n total lockers.

This is more like it. Now when someones asks about 100 lockers, I can find a solution quickly. What squared is 100? It’s 10 of course, so there are 10 open lockers after this sequence of events has been applied to 100 lockers. For any number, n, of lockers, the number of open lockers after n people have run though them is ?n rounded down.

So now I have my answer. I just need a reason. Why is it the case that the open doors follow this pattern? What that really boils down to after looking at it for a bit is the question: why are the only doors left open doors that are the square of a number? Does this mean that only square numbers have an odd number of unique factors?

Square numbers are the only numbers that have an odd number of unique factors because factors can come in pairs. With a square number, one of those pairs is made up of two of the same number, and in this situation that can only count as one toggle, not two.

So take locker number 10 for example. It has factors 1, 2, 5, 10. In this case 1 goes with 10 and 5 goes with 2. They cancel each other out and the locker stays closed.

The number 9, on the other hand, has factors 1, 3, 9. Here the 1 and the 9 cancel each other out, but the 3 doesn’t have anything to cancel it out. The locker remains open.

It turns out that getting sidetracked about closed form solutions for each individual door actually did provide the hint to understanding the problem.

You can get the code I used for my images here.

Toy Economies

I went to Ada’s Books last week. They had a lot of textbooks, which I wasn’t too interested in. They also had a lot of science books, which I wasted half my day (alright, just 20 minutes) perusing. I ended up buying Group Theory in the Bedroom. It’s a collection of essays some guy wrote for a variety of science magazines.

A couple days ago I read an article in the book about conserved economies. The idea is that you can model economic behavior if you make some simplifying assumptions (like that people spend exactly as much as they earn). What really intrigued me about the article were the graphs of wealth distribution over time. By slightly tweaking various economic parameters, it’s possible to make economies collapse by concentrating all wealth in the hands of one person.

I’ve been toying with Processing a lot lately, and these graphs finally gave me an excuse to get started. I wrote up a quick toy economy sketch and generated my own versions of the economies described in the book.

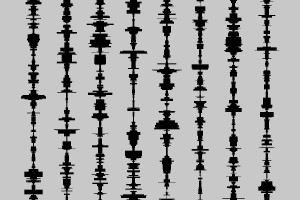
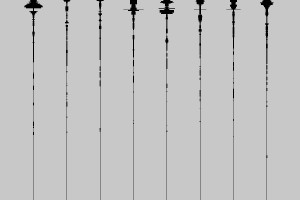
Wealth in a stable economy is rarely concentrated.
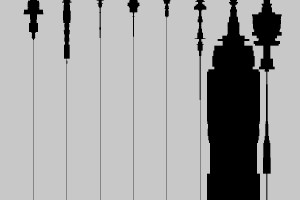
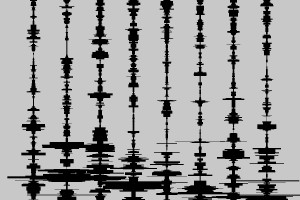
Wealth in an unstable economy all belongs to one person.

These economies are super simple. No one ever makes or loses money, except in a transaction with someone else. In those transactions, someone makes money and someone else loses money. Each line is a person’s wealth over time (time 0 is at the top). The width of the line corresponds to how much money they actually have.

So we’re basically assuming that everyone has some amount of money in savings, and that they spend exactly as much as they make. I like saving, so I added a savings feature. Everyone gets one unit of wealth each time step. In order to keep people from accumulating infinite wealth, I set up a random event that would force them to spend their savings. Now each person saves for a rainy day, and they periodically experience those rainy days and have to spend their savings.

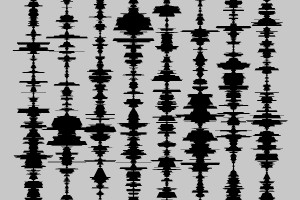
Saving in a stable economy don\’t make a big difference.
Savings in an unstable economy aren\’t very realistic.

A normally stable economy remains essentially stable. People do manage to save up a higher maximum amount of money, but they don’t really keep it for very long. It also doesn’t give people a leg up in exchanges.

That changes in an unstable economy. The person who ends up owning all the wealth really gets it all. It’s kind of ridiculous. Surprisingly, even the people who don’t get very wealthy still don’t get as poor as they would have if they hadn’t saved a little. It seems that extra boost gives them a little more leverage in an exchange. One thing to keep in mind about this is that the agents aren’t allowed to go into debt. If agents could have negative money, this situation might be very different.

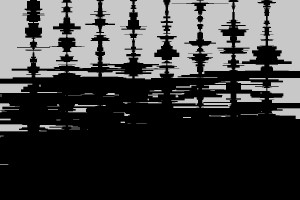
Since I’ve been interested in startups and entrepreneurs for a while, I decided to add that into my economy as well. I gave entrepreneurs some chance to win much more than they already have, but also to lose much of what they had. It turns out this is a hard thing to get stable. If succeeding in a startup is too hard (and too many people try), the entire economy collapses pretty quickly. On the other hand, if it’s very easy then everyone ends up ridiculously wealthy. It seems like that kind of situation would lead to hyperinflation, which wouldn’t really be a good thing.

Too many failed startup kill an economy.
A Goldilocks economy is just right. Everyone starts to get rich at the end.
Easy money means hyperinflation.

These models are way too simple to accurately represent a real economy. Real economies have a lot of intricacies that I didn’t want to go into for this. One of my EE professors once said that we’d never find the “Maxwell’s Equations of Economics” because there was simply too much going on. That’s probably true, but there’s something poetic about modeling economies in such a simple way.

Get the code here.

Arduino + Processing = Etch-a-Sketch

I’ve been using the Arduino for a few years now, but all of my projects with it were pretty self contained. I made some robots and some light controllers, but those things just sit there and do whatever it is they do. Until now, I’ve never used the Arduino as an analog front end for a PC. A lot of people seem to use the Arduino only for that purpose.

I was sitting around the other day thinking about this, and I decided I’d try to figure out how to do it. I could have just written something that would communicate with the Arduino over USB (kind of like RepG does with the MakerBot), but I only had an hour and I wanted to get something working quickly.

Enter Processing. I’ve only made one project with Processing before, but it did make it pretty easy. I’ve also heard that Processing interfaces with the Arduino easily. So now I had two tools, the Arduino and Processing, I just needed something to build with them. I looked in my junk box, and found two nice 100k potentiometers. This reminded me of the Propeller based Etch-A-Sketch. Since I didn’t have an Etch-a-Sketch handy, I just decided to use the potentiometers to draw pictures in Processing.

I hooked my Pots up to the first two analog inputs of my Arduino and did a quick google search. Turns out that processing communicates with a prewritten sketch called Firmata. The Arduino IDE comes with a couple of different versions of Firmata, each geared towards a different usage of the Arduino. The AnalogFirmata sketch worked pretty well for my needs.

A few minutes later, I’m twiddling my pots and drawing pictures. I also added a button to my sketch to allow me to save whatever I was drawing. This was actually the hardest part of the whole endeavor, because the AnalogFirmata didn’t have digital inputs. A little copy/paste action from the DigitalFirmata to the AnalogFirmata, and I was back in business.

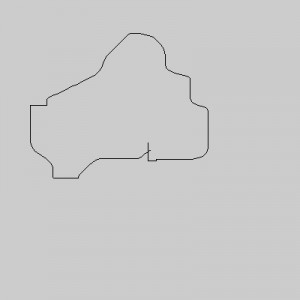
I drew Greenlake.

Etch-a-Sketch Greenlake
Ya, I never learned how to use a real etch-a-sketch either.

Find the Code here